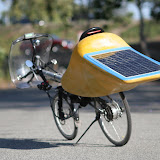
Given that most visitors to this blog seem to be interested in building a solar powered bicycle, I thought it might be helpful to share some information about how you can evaluate the range of such a vehicle based on the solar resources available in your area. My interest in building a solar bike is to extend my daily range on a long bike tour (think cross country) so I want to know "how many solar miles per day?" Here's how we figure that out.
We will need to know the efficiency of our motor. I measured mine by using a Watt's Up power meter (the Cycle Analyst will also work) while riding around a flat parking lot without pedaling until my battery's management system (BMS) cut out. I went 17 miles and used 217 Wh of energy so my motor's efficiency in this scenario was 12.8 Wh/mile (8.0 Wh/km).
Under more typical riding conditions where I'm pedaling most of the time and going over hilly terrain, my power consumption is about 8-12 Wh/mile (5-8 Wh/km) depending on how hard I'm pedaling and how steep the hills are. If you weigh more than me your power needs will increase. If your riding involves a lot of stops your power needs will increase. You will need to run these tests for yourself to get reasonably accurate figures but you can use my numbers as a starting point for your planning.
 Next, we will need to assess how much sunshine is available where we will be riding. This chart shows year-round insolation data for the United States. I live in Northern California which is in the light green band between the yellow area in the southwest and the darker green along the Canadian border on this chart. Don't worry about what the colors mean. I've included this chart so you can get a rough idea if you can expect more or less sunshine where you live. Phoenix, Arizona gets more sunshine than I do. Chicago, Illinois gets less. Here's a global insolation map.
While this map is useful for a quick visual assessment, it doesn't give us the numbers we will need to figure out our solar miles per day. For that, we will need to look at the Solar Radiation Data Manual for Flat-Plate and Concentrating Collectors. In the United States, the National Renewable Energy Laboratory (NREL) has been collecting solar radiation data at 239 sites spread across all 50 states from 1961 to 1990. The reports include average monthly sunshine for each site and they take into account weather like clouds and fog. The amount of information available in these reports is overwhelming but I'll show you which figures are useful for our solar bike project.
 Let's look at the report of Sacramento, California. We will use this site instead of San Francisco because they're both at the same latitude but Sacramento's weather is more like the weather in Oakland where I live. The San Francisco numbers are a little lower because local microclimates create pockets of fog which reduce the amount of available sun. The numbers I've highlighted show the average number of sun hours per day. This is not the same as number of daylight hours. These numbers take the peak sunshine at solar noon and tell us the equivalent number of such hours per day. You get much less power early in the morning and late in the evening but the total output for the day measured in "sun hours" means "as if the sun had been shining at full intensity for this number of hours."
This is very useful because now we can take my solar panel's peak power output (41 watts in full sun) and multiply it by the number of sun hours per day to get watt-hours (Wh) per day. Please keep in mind that we're not using the panel's theoretical rated output but actual power measured between my charge controller and my battery on a hot day. This panel would probably be rated at about 55 watts at STC but we're only interested in actual, real-world output.
So we have 41 watts in peak sun times 7.2 sun hours in May for a 0° tilt panel for a total daily estimated production of 295 Wh. My actual measurements with the Watt's Up meter confirm this number (based on multiple 50 mile trips). This reflects energy collected per day while riding. To account for occasional shading from trees, buildings, and the rider's body casting a shadow on the panel, we'll subtract 20% from this figure. To account for battery efficiency losses (we have to put in 220 Wh to get out 200 Wh), we'll subtract another 10%. This gives us 207 Wh/day while riding.
On a tour, I may spend half the day riding and half the day with the bike parked in the sun. When it's parked, I can tilt the panel and turn the bike so that the panel is perfectly perpendicular to the sun (dual-axis tracking). My power generation will increase by 45 to 115% compared with 0° tilt, depending on the time of year. The NREL data shows 10.2 sun hours for dual-axis tracking in May. This would give me 41W x 10.2 hrs/day = 418 Wh/day. Subtracting 10% for less-than perfect tracking (maybe we only adjust the panel once per hour) and 10% for battery losses gives me 334 Wh/day during parked "charging mode."
So if I ride half the day and park half the day on my tour, I will generate 207/2 + 334/2 = 271 Wh/day. On flat ground, without pedaling, this translates to 21 solar miles per day. If I add the effect of hills and my pedaling efforts into the equation (8-12 Wh/mile), we have 23-34 miles per day. Adding the power from 2 batteries charged overnight, we get 60-90 miles/day. Adding a second panel (@ 60 watts) we're up to 1128 Wh/day or 94 to 141 miles/day.
Keep in mind that these numbers represent average monthly and yearly figures including all foul weather days with little or no sun. If you're a hard core commuter who rides rain or shine, your numbers should closely resemble these averages. However, if you're a fair-weather rider who selectively avoids days with little sun your averages should look better than these numbers.
Here's how all this looks in a spreadsheet. You can also access the interactive version of this spreadsheet and plug in your own numbers. Some figures may vary from the article above because I update the spreadsheet as I gain additional road test data and better understanding of solar-assist cycling.
